Category Archives: No Child Left Behind

MMSD Budget (Crunch) Time (Updated)

“Money Talks,” Alex Chilton (click to listen or download)

Update:

The materials for Monday’s meetings (Budget Input and Operations Work Group)have been posted on BoardDocs.  I’ll list and link here, but first there are some things that were not posted that need to be addressed.

A choice was made to exclude from the meeting materials all of the suggested cuts/funding sources that were part of the the Budget Amendments submitted by Board Members (at this time it is not clear who made that choice). The full Amendments are in the original post below.

This is unprecedented.  It is absolute and basic that proposed amendments submitted in advance be included in the materials distributed to the public and Board Members.  They must be part of the record, they will  be part of discussion, and the public has a right to know what is on the table (especially in advance of a “public input meeting). 

It should also be noted that those Board Amendments that are present in the meeting materials, are present only in summary form.  My Amendments did not include extensive rationales, but Anna Moffit’s did, and to not share these with the public is wrong.

Additionally, the full Title I chart included in this post (below) is not posted, with only an explanation of the process provided.  There is also no further information on Title III and tuition for Ell certification (listed in my Amendments as something I would “like to explore”).

An earlier Budget Presentation included the “Goal” of “Greater transparency in budget development.”  The choices that have been made to not include Board Member Amendments take us further from that goal.

Here is what is there:

Starting next week, there are a few important meetings for the Madison Metropolitan School District Preliminary Budget (much budget info at the link, a bit more below).  Here are the key meetings:

If you can’t make these, you can always write the Board: board@madison.k12.wi.us.

A couple explanatory things at this point.  First, detailed agendas and materials for these meetings will be posted on BoardDocs in advance, usually at some point on Friday for a Monday meeting.  Second, the final Budget is not passed until October, after many things — especially the state aid certification — are set.  Amendments and changes are possible up to that point, but the Preliminary Budget is what is in place when schools open in September, and for this and other reasons is important.

From my point of view there are three major places where there may be action: 1)Budget Amendments from Board Members (Anna Moffit and I both submitted amendments, more below); 2)Title I funding (Federal poverty aid, more below in the discussion of my amendments, with some linked documents and  information previously not posted by MMSD); 3)The structure of employee health insurance contributions (because my spouse is employed by the district, I recuse myself on this).  The latest on this is here (expect more before the meetings listed above).

May as well start with my Amendments.  Here is what I submitted for consideration (I may or may not make motions on individual items).

Initial Budget Amendments

TJ Mertz

May 23,2016

I understand that in the current budget situation any additional spending must come from reallocations, but believe that it is counterproductive to match each proposed addition to a cut. Instead I have listed cuts and additions separately, with a final item on Title I and Title III.

Items to Be Cut

  1. Eliminate Assistant Principals at Allis, Kennedy, Stephens and Cherokee.

Note: 4k at Allis may mean that numbers justify this position. [Note:  My understanding is that traditionally an Assistant Principal is added when school population is above 500; these are all below.  I asked about this at a meeting and did not get an answer.]

  1. Cut Tech Plan Spending by $300,000.

The Baird projections show an initial $8.74 Million gap for 2017-18, and this assumes the continued $250/student categorical aid, and an additional $100/student. Under these circumstances I do not believe that increasing Tech Plan spending by $625,000 is sustainable.

  1. Eliminate Special Assistant To the Superintendent for Special Projects.

  1. Cut Employee Travel Conferences (0344) from $468,803.63 to $300,000.

  1. Cut Space Rental Events/Meetings (0328) from $175,875.99 to $111,774.14.

The proposed budget includes an increase, this amendment returns the amount to that in the 2015-16 budget. The Badger Rock rental was moved to object 0329 and is not impacted.

Additions

I support Anna’s proposals on expanding Intensive Support Team staffing and targeting class size at “intensive touch” schools, (as well as the reallocations she proposes).

  1. Add Board Research and Data NUP, $70,000

This position would work for the Board of Education and assist in fulfilling data requests, researching policies, and preparing analyses and briefs independent of administrative structures.

Strategic Framework Priority Area – Accountability.

  1. Restore Middle School Staffing (to the extent possible)

According to the March OWG presentation, 12.000 FTE, budgeted at $1,181,679 will be cut from Middle Schools. Without the detailed information in the Equity Chart, it is impossible to know what these cuts might be, but I would like to explore restoring some or all. Many of our Middle Schools are struggling with a variety of issues, and I think we need to make sure they have the capacity to be successful.

Strategic Framework Priority Areas – Coherent Instruction, Thriving Workforce, (and perhaps Personalized Pathways and Family and Community Engagement).

Title I

I may be offering amendments addressing the Title I Reserved budget (funds not allocated to schools), the poverty measure(s) used to allocate Title I to schools, the formula used to determine the allocations to schools (my understanding is that we can allocate a higher dollar amount per student to schools at higher poverty levels, I don’t know if we are doing that, but would like to explore the possibility).

Title III

It is my understanding that that $300,000 three year budget for ELL certification tuition reimbursement appears to be much more than anticipated spending (Mike provided me with a summary). I believe this is Title III money, which means there are limits on how it might be reallocated. I would like to explore the possibilities, especially using some of this money to replace unrestricted funds, or to improve direct services for ELL students.

I would be glad to answer any questions about any of these, but am going to mostly forgo long explanations and justifications here (the bracketed note on the Assistant Principals was added as an explanation for this post).  The two exceptions are Middle School Staffing and Title I.

On Middle School Staffing, just a couple of things.  First, budget pressures and choices made in drafting the preliminary budget led to school-based cuts at all levels.  At the Elementary level, there were two big factors.  The first was decreased enrollments; the second was what might call a “relaxed” approach to class sizes in the early grades (Anna Moffit has an Amendment on this, below).  The Middle School cuts were pretty much straight out budget based.  At this point — less than a week before we have the penultimate meeting to discuss the Budget and less than a month before we vote — I don’t know how these cuts were decided (other than the phrase “Equity-based” has been used, whatever that means), nor what schools got what cuts.  We have some info (below, and it may be out dated), but not much.  This make it hard to do the job we were elected to do.   I believe school based staffing allocations are at or near the top of budget issues and have been asking for information on the processes and results since at least February.  I hope we get this in the “Equity Chart” this week, and if changes seem like a good idea, I hope it isn’t too late.

Here is a staffing chart, with Title I information as of late March (read the notes in the link, about what this chart represents).

Title I Staffing Enrollments

The “Equity Chart” should provide more detail and be more up-to-date.  In reference to Anna Moffit’s second Amendment below, it is also worth noting that some of the Elementary School cuts do not seem to align with (projected) enrollment changes, this may be due to the interactions of grade level projections and desired class sizes (I have not looked closely, but will try, and would appreciate it if anyone else would like to make the effort, and share their findings). Depending on what I learn (and what else happens), I may or may not go ahead with an Amendment on Middle School staffing.

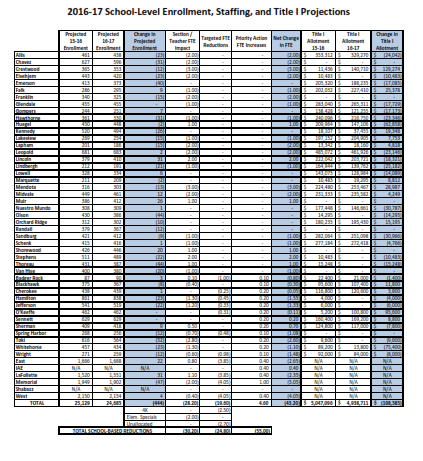
We do have new information on Title I since I offered the Amendments and it is good news.  Some background, first.  You can find everything you would want to know and more about Title I at the Department of Education page.  Essentially, it Federal aid to schools serving students in poverty.   It is also the biggest source of Federal money in k-12 education, so from a policy perspective, it gets used as a carrot and a stick.  In fact there are all sorts of of controversies about how Title I will be distributed under the new Elementary and Secondary Education Act.   Local districts have a number of choices to make with Title I.  We decide (with some limits) how much is allocated to schools, and how much is “reserved” for district initiatives (see here for information on MMSD “Reservations”).  We decide what measure or measures of poverty will be used to distribute funds to schools.  We decide (with limits) what the poverty percentage cut-off will be for designating a school Title I.  We decide what levels — Elementary, Middle, High —  we will fund via Title I.  We decide how we will allocate to schools on a per qualifying student basis (do we give higher poverty schools more per student)?  All these decisions and more.  In Madison four things have brought Title I to the fore.  First, in 2014-15 MMSD expanded Title I to Middle Schools.  Second,  because some Madison schools are participating in the Community Eligibility Provision (CEP) which provides free meals to all students, the traditional Free/Reduced Lunch poverty measures have been impacted (see here for much much more on Title I and CEP, including analyses of some of the decisions listed above, worth a read).  In response, MMSD, like many districts is using what is called “Direct Certification,” a method that matches students to family enrollments in other government aid programs to arrive at student poverty numbers.  Third, for the first time since the 2008 referendum MMSD does not have unused revenue authority, this budget is especially tight.  Last — and this is the good news — recent reallocations show MMSD receiving $788,000 in additional Title I funding.  The initial Title I allocations (similar to the above chart) showed many schools with funding cuts (often on top of other staffing cuts).  With the $788,000 this has changed.  See here:Title I with 788000

You can see almost all schools received an increase, and that the schools are tiered, with higher poverty k-5 schools getting more per student, and Middle Schools getting a flat (and low) $750 per student.  More on the process MMSD used here.

But questions remain.  Is direct certification the best way to estimate poverty?  Are the tiers, the cut points, and the differences per student between them the right things to do? Is the Middle School/Elementary difference good policy (remember k-5 schools also have SAGE (now AGP) for the early grades)?  I am not committed to any changes from the proposed allocation, but I do want to think about these questions, hear from the community, and discuss the choices with other Board Members.

Here are Anna Moffit’s Amendments.  As stated above, I support them.  I am not going to say more at this time, Anna Moffit has already published a strong op ed on the first, and I am sure she will be equally eloquent on the other at the appropriate time.

#1 – Intensive Support Teams

Budget Amendment
Increase the Intensive Support Team staff by 3.5 FTE (1 FTE for the Autism /Significant Developmental Delay team/ 2 FTE for the behavioral health team and .50 for a clerical assistant).

Rationale:

Based on community feedback and staff input there is an increased need to support   our students with intensive behavioral and mental health needs. According to   anecdotal information and district data there are a small number of students that are currently receiving a disproportionate amount of behavioral referrals (about 1% of our students make up 95% of behavioral referrals). Many of these students have documented or undocumented diagnoses, learning difference or a trauma history that require an acute and elevated levels of support in order to be successful in our schools.

Rather than restrict eligibility criteria that create more barriers for students to accesss specialized services, we should be proactive and prevent escalating disciplinary measures that lead to exclusionary practices by increasing our capacity to serve more students in a timely matter. By investing in programs that prevent suspension and expulsion, hundreds of thousands of dollars can be saved for our district.

Building the capacity at the district level to provide immediate help and ongoing professional development to non-Student Services staff via our Intensive Support Team is more cost effective in comparison to paying for expensive, outside consulting services and trainings. Based on staff feedback, there is an increased need for professional development in the area of working with students that have intensive mental health and behavioral challenges in our district.
Currently, the Intensive Support Team doesn’t have the capacity to organize, schedule and provide professional development in an efficient and effective manner due to limited capacity. By providing additional team members and a clerical position, scheduling professional development during educators’ planning time would be more consistent across the district. This increase would also of-set some of the the cuts made in the previous year to Students Services staff (21 Student Services staff).

Possible funding streams:
BEP professional development:
Based on anecdotal data from one-on-ones with staff and Board presentations,
opportunities for professional development have been limited and difficult to attend due to other commitments, not due to lack of interest or need. There was no additional information provided to the Board that would support lack of interest or need as the basis for not utilizing professional development funding. In fact, Behavior Education Plan surveys continue to indicate their is a high interest in increased professional development in order to meet the diverse and dynamic needs of our student body.

Access to bilingual education:

The district will not be expanding the DLI program to all schools put forth in the ELL plan which should lead to a decrease in FTE by .50 for an additional DLI planner. This would provide about $43,755 dollars in additional funds. There are very few students and families (currently 4 families based on feedback from Principal) that have shown interest at Thoreau Elementary in the DLI program at a to-be-determined school, therefore $36,000 dollars appears to be an excessive amount of money set aside for transportation costs for busing. In total, there would be about $70,000 dollars in additional funds.

Other possible funding sources:

TID 25 loan

Reduce spending on Technology Plan

Reduce spending on Educational Resource Officers

Utilize funds saved from not filling the position of Special Assistant to the Superintendent ($125,000 dollars).

#2 Elementary School Staffing

Provide additional FTEs to all of our “intensive touch” elementary schools in order
to ensure that all K-2 classrooms can begin the year 16 students in each classroom. The funding source is undetermined at this time due to lack of information in regard to Employee Premium Compensation limits for district staff members, as well as resolution in regard to TIF 25.

Rationale:

Based on extensive research, class size has the most significant impact on student achievement in the early childhood years. Smaller class sizes have shown to have a greater impact on academic achievement than aligned curriculum, as well as instructional coaching. Smaller class sizes also ensure that students and teachers have the time to develop strong, positive and reciprocal relationships which lay the foundation in developing a child’s resiliency. Resiliency has been shown to counter-act the effects of Childhood Trauma that is a direct result from children experiencing toxic stress at home, school and community. Students that experience chronic toxic stress are more likely to develop learning disabilities, maladaptive behaviors, as well as an increased risk of substance abuse issues and mental health challenges.

Although Governor Walker has provided district a “tool” called AGR to increase class sizes for our most vulnerable students, I believe that it has a detrimental effect on student learning for our youngest learners. With large numbers of black students, students receiving Free and Reduced Lunch, English Language Learners and students with disabilities not reaching adequate reading and math outcomes, leading to huge disparities, it is critical to invest our resources in high leverage strategies that can close these gaps.

Lower class sizes has also been a priority identified within our budget feedback from schools and the community.

There may be other ideas that lead to late amendments, or revisions of these.  Please remember, these are our schools, our children, and the School Board Members are your representatives; be part of “the village” by participating, making your voice heard at (or prior to) the meetings listed at the top.  I’ll be listening, and others will too.

Thomas J. (TJ) Mertz

1 Comment

Filed under "education finance", Accountability, Best Practices, Budget, education, Equity, finance, Local News, MMSD, National News, nclb, No Child Left Behind, School Finance, Take Action, Technology and Educaion, Uncategorized

John Dewey on comparing students — Blast from the Past/Quote of the Day

Sly & the Family Stone, ” Everyday People” (click to listen or download).

How one person’s abilities compare in quantity with those of another is none of the teacher’s business. It is irrelevant to his work. What is required is that every individual shall have opportunities to employ his own powers in activities that have meaning.

John Dewey

Democracy and Education, 1916

The current “accountability” madness is almost all based on misusing metrics of questionable value to make comparisons among students, among teachers, among schools, among districts, among nations (see here and here for two recent manifestations).  If we are going to be “holding people accountable,” I’d prefer the metric be whether they are providing all students with the “opportunities to employ his [or her] own powers in activities that have meaning.”

Related:  National Opportunity to Learn Campaign and Opportunity to Learn Wisconsin.

Thomas J. Mertz

Leave a comment

Filed under "education finance", Accountability, Arne Duncan, Best Practices, Blast from the Past, education, Equity, finance, Gimme Some Truth, Local News, National News, nclb, No Child Left Behind, Quote of the Day

How Many Strikes? or Whither Accountability? #2

The Isotopes – “Take Me Out To The Ball Game” (click to listen or download)

A recent post  —  Who cuts the barber’s hair? or Whither “accountability”?  — centered on some of the failings of the new Wisconsin “Accountability” system designed by team led by  Scott Walker and Tony Evers and adopted in order to gain an NCLB waiver from Arne Duncan and what we as citizens can do to hold them accountable for the bad choices they have made.  With the second iteration of the “Accountability Requirements for Achievement Gap Plan“(online version ahs been updated on pages 58-9 ,see here) on the agenda of the Madison Metropolitan School District Board of Education Student Achievement and Performance Monitoring Committee this Monday (11/5, 5:30 PM, rm 103, Doyle Blg) I thought it would be a good idea to do something similar on the “Accountability” work being done by MMSD.  This time via an extended and at times strained baseball metaphor.

Who’s at bat?

Or who should be held accountable for the accountability design work being done by MMSD? These aren’t easy questions.  Accountability is confusing, maybe not as confusing as the Abbott and Costello routine, but confusing (who should or should not be held accountable for the results of accountability measures is even more confusing….add teachers, families, the economy, inequality, …. to the list below).   The chain of accountability goes from the voters who elect Board Members, to the Superintendent who the Board hires, fires and evaluates, to the administrators the Superintendent hires (with the consent of the Board, but for better or worse this has been a rubber stamp consent), supervises and evaluates.  It also loops back to the Board, because they are responsible for making sure administrators have the resources they need to do good work, but this chain continues back to the Superintendent and the administrators who prepare draft budgets and should communicate their needs and capacities to the Board.  The Superintendent is the bottleneck in this chain each time it loops around because the the MMSD Board has almost entirely limited their action in evaluation, hiring and firing to the Superintendent.  Right now MMSD has an Interim Superintendent, so evaluation, hiring and firing  is moot and the key link in the chain is broken.  Like I said, confused.

What is clear is that the only lever of accountability community members hold is their vote in school elections.  Three seats are up in April (Board President James Howard has announced his intent to run for re-election; Maya Cole and Beth Moss have not publicly stated their plans).

The impetus for creating the “Accountability Requirements” was a budget amendment from Board Member Mary Burke.  I believe it passed unanimously.   For the purposes here, I’m saying “The Administration” is at bat and the Board of Education is the manager sending signals from the dugout.  I didn’t count, but there are at least a half dozen administrator names listed on the “Accountability Requirements for Achievement Gap Plan,” if you want to get more personal with who should be accountable, feel free.

Swinging for the Fence or “Small Ball”?

The public loves power hitters; the long ball is a crowd pleaser.   Baseball insiders and aficionados understand that swinging for the fence increases the likelihood of striking out and that often the situation calls for “small ball,” like trying to draw a walk, attempting a sacrifice bunt, hitting behind the runner, or lining a single in the gap. the key to small ball is that you do many little things and they combine to produce runs.

With educational “accountability” I would argue that setting “goals” (any goals at all, but especially unrealistic ones like the NCLB 100% proficiency, or the “goals” listed in the draft MMSD”Accountability Requirements,” more on the latter below) is the equivalent of swinging for the fence.  This is part of the “data driven” mentality.  I think the situation calls for an educational version of small ball, something not as crowd-pleasing, demanding a higher level of engagement by all involved, and more likely to produce a productive unerstanding.  What I have in mind is monitoring multiple measures, or “data guided” decision making.

Although the reporting has not been good, MMSD tried something like this with the Strategic Plan “Core Performance Measures.”  Unfortunately there seemed to be collective agreement among Board Members and administrators at a recent meeting that these measures would be set aside in favor of the “Accountability Requirements” now under consideration and by implication that all the Strategic Plan work would be left to gather dust.  There were targets associated with “Core Measures”  but the main idea was that the Board and the Administration pay regular attention to multiple measures and their movement, individually and collectively.   This is far different than stating as a goal that 90% of students will score in the proficient range by year 3.  The first thing  policy makers need to know is whether things are getting better or worse and at what pace.  The use of standardized test score goals  (and goals for many other measures)  in “accountability” doesn’t help with that and creates difficulties.

What is the “accountable” action if some measures go up and some go down?  What if demographics or the tests themselves change along the way?  And then there are the uncomfortable questions of who will be held accountable and how  if none of the goals are met. We should have learned from NCLB that this approach is not what the situation calls for, but apparently MMSD administrators did not.

At a previous meeting on the   “Accountability Requirements” Board Member Ed Hughes moved closer to the small ball position by suggesting that instead of absolute goals, the goals be presented in terms of change or growth.  Better, but the problems identified remain.    The whole goal oriented approach could be called “Strike One,” but I’m not going to do that.

Strike One

The first draft of the “Accountability Requirements”  was presented to the Student Achievement and Performance Monitoring Committee on September 30th and appeared essentially unchanged on the full Board October 29th agenda as part of a Committee Report.  In baseball parlance it was a unbalanced, badly mistimed swing for the fences at a ball well outside the strike zone.  It isn’t pretty.  Strike one.

Some managers would have been tempted to pull the batter and send up a pinch hitter, but instead Board Members  sent some signals from the dugout, pointing out some of the mistakes and offering tips for improvement.

Mary Burke noted that the left hand and the right hand didn’t appear to be coordinating.  To be more specific, she pointed out that on page 15 (of the pdf) there is a chart with the stated goal “95% of all 11th graders will take the ACT in 2012-13,”  but chart itself  shows  annual incremental increases, culminating at 95% for all groups in 2016-17.   It was long ago decided that all students would take the ACT in 2012-13, whoever prepared the left part of the chart knew this, but whoever did the increments on the right did not (and apparently didn’t read the left part).  Here it is:

Other problems with the swing are more subtle.  There is also another section where ACT goals are expressed in terms average scale scores.  This appears to be another case of lack of coordination between the two hands.  As discussed below, the sections related to students reaching the ACT “College Readiness” benchmarks are left mostly blank in recognition of the fact that increased participation due to the test-taking mandate will almost certainly lower the starting point.  The people doing the average scale score section don’t seem to have understood that.   Their chart shows steady and unrealistic growth (except a 0.1 drop for white students in the final year), with all reaching 24 after five years.  Here it is:

This is absurd.   At Hersey High School in Arlington Heights IL, a much less diverse school with much lower poverty  than MMSD (14% low income) that since 2001 has become the Mecca for those who worship at the alter of the ACT/EXPLORE/PLANN system of placing ACT prep at the center of school activities, no doubt starting above the MMSD full participation benchmark, it took six years to get the composite average  to 24.0 (the current is 25.2).  Closer to home, the temple for ACT worshipers is (much less diverse, at 15.8% Free/Reduced Lunch, much less impoverished) Monona Grove.   They joined the ACT religion in 2008-9.  That year their ACT composite was 21.7; it is now 22.3Nationally, only 26% of (mostly self-selected) test-takers achieve a 24 composite.  Absurd and incompetent.

You may think this is nitpicking, but these are highly paid professionals who didn’t do their homework to arrive at realistic goals and have made the kind of stupid errors that would cost students serious points on the standardized tests that these same highly paid professionals are employing in the name of “accountability.”  Shouldn’t they be accountable?

Despite some coaching from the Board that resulted in fixing the above issues, problems related problems remain the second version.  Those are covered in the “Strike Two” section.

Strike Two

The second swing  — the version of the “Accountability Requirements for Achievement Gap Plan” on the 11/5/12 agenda —  is much expanded (61 pages in comparison to 31), but not much improved.  Another wild, unbalanced and mistimed lunge at an almost unhittable pitch.  Like the first (and so many of the things produced by MMSD administration) much space is devoted to documenting that staff are very busy (of course repeatedly documenting this helps keep people busy) and very little to what is going on with students (I’m not sure why this is “accountability’).  Like the first, the actual “accountability” focus is on “goals.” Like the first, many of these goals (and many of the benchmark starting points) are left blank or labeled “TBD.” Like the first, where there are numbers attached to the goals, they are wildly unrealistic.

As the play-by-play announcer, I’m going to limit detailing how this swing misses to two places where numbers are attached to standardized test based goals.  The first involves the ACT; the second the state achievement tests (now WKCE, soon to be  “SMARTER Balanced Assessments”).

As explained above,  I  don’t like “goals” in standardized test based “accountability systems” (I’m not very fond of standardized test based “accountability systems” in general, but no room for all that here), but if you are going to have goals, they should be realistic, they should be based on in-depth knowledge of the tests, the performance of comparable students on these tests, and the improvements achieved elsewhere using similar programs.  As one Board Member pointed out at a recent meeting, this is exactly the kind of expertise that the Board expects from their highly paid professional administrators.  They ain’t getting what they paid for (in baseball terms, we are approaching  Alex Rodriguez in the last post-season).

The error Mary Burke pointed out with ACT participation has been corrected..  At the previous meeting there was a discussion of how expanded ACT participation will yield new baseline starting scores, and this was (in the first version) and is (in the second version) reflected by leaving blank most those portions  covering percents of students scoring at or above the college ready benchmarks set by the ACT.  For the same reasons,  the ACT “Average Composite Score” section discussed above is now blank.  All this is good,  but in the left hand column of the benchmark charts in both versions ,for each subject area there is a 40% goal (page 32).  I’m going to leave aside important criticisms of the ACT Benchmarks, to address why the 40% goal is problematic.   Nationally last year, only 25% of the mostly self-selected test-takers met the benchmark in all four subjects.  The percents varied greatly, from 67% in English to 31% in science.   At Hersey High (with their test friendly demographics and over ten years of emphasizing the ACT) only 39.2% of test-takers made all four benchmarks.   The goals for MMSD should reflect this reality, (and similar evidence on subgroups;i it should be noted that you can reach the 40% goal in each individual subject and still not have 40% meeting all four benchmarks, but my point is that the data we have shows that 40% is easier or harder for different subjects , and that 40% in any may be  out of reach in some subjects).

There are similar, but more pronounced and complex problems with the section that sets goals of 90% “proficiency” on state tests in Mathematics and Literacy at the end of five years (page 17).  Here is the chart for literacy (sorry for the bad reproduction):

Although the WKCE is referred to, the numbers in the far right column reflect the very problematic “WKCE as mapped to NAEP cut scores” (see “The news from Lake Gonetowoe” for some of the problems with these cut scores) and the WKCE is on the way out to be replaced by “SMARTER Balanced Assessments,”   Some confusion here that I’m going to avoid by simply saying “state tests.”  Since the NAEP derived cut scores are the order of the day, I guess MMSD has to use them, but they have a choice about which levels to concentrate on and “Proficient” is the wrong level.

My preference would be to do the multiple measures, small ball thing and track movement among scale scores, or failing that movement among the various cut score defined levels (which is what the “Growth”  calculation in the new Report Cards does).    If you are only going to use one level and are going to set goals, “Basic” is the level you want.  It is where you will see the most movement and get the most useful information.

Eventually I hope to do a few more posts about the meaning of NAEP cut score levels and how they compare to the old WKCE levels and many related things.   For now I’m going just repost my new favorite quote from National Academy of Sciences publication, “Grading the Nation’s Report Card: Evaluating NAEP and Transforming the Assessment of Educational Progress,”

and add the general NAEP level descriptions (there are more detailed ones for the grades NAEP tests, 4, 8, and 12).  Here is the quote (again):

Although standards-based reporting offers much of potential value, there are also possible negative consequences as well. The public may be misled if they infer a different meaning from the achievement-level descriptions than is intended.  (For example, for performance at the advanced level, the public and policy makers could infer a meaning based on other uses of the label “advanced,” such as advanced placement, that implies a different standard. That is, reporting that 10 percent of grade 12 students are performing at an “advanced” level on NAEP does not bear any relation to the percentage of students performing successfully in advanced placement courses, although we have noted instances in which this inference has been drawn.) In addition, the public may misread the degree of consensus that actually exists about the performance standards and thus have undue confidence in the meaning of the results. Similarly, audiences for NAEP reports may not understand the judgmental basis underlying the standards. All of these false impressions could lead the public and policy makers to erroneous conclusions about the status and progress of education in this country. (Emphasis added)

Here are the descriptions:

Achievement Level Policy Definitions
Basic This level denotes partial mastery of prerequisite knowledge and skills that are fundamental for proficient work at each grade.
Proficient This level represents solid academic performance for each grade assessed. Students reaching this level have demonstrated competency over challenging subject matter, including subject-matter knowledge, application of such knowledge to real world situations, and analytical skills appropriate to the subject matter.
Advanced This level signifies superior performance.

I think that at this time the “Achievement Gaps” work in MMSD should concentrate on getting students to the “Basic” level, as defined by NAEP.

This belief is reinforced by national data on student NAEP performance.  This first chart shows the 8th grade NAEP level distribution for all students (NAEP tests a sample of students and adjusts reporting to reflect the entire population, charts from here):

In 2011 42% were in the “Basic” level.  This is where the median and mean are.  If we are most concerned with the students who aren’t reading and can’t do simple math, that means moving them from “Below Basic” to “Basic.”  I have no problem with also monitoring “Proficient” and “Advanced,” but the heart of this is in the basic category.

Two more graphs to show a little more of this and transition to the goals being set.  This one shows the distribution of scores for those students not eligible for Free and Reduced Lunch:

The next is for Free Lunch students (NAEP reporting here does not combine Free and Reduced):

I’m not going to deny that the “proficiency” gap between these two groups of 28 points isn’t worthy of attention, but I will argue that the gap in “Basic” or above of 26 points and the gap of 22% in those reaching “Basic” are more important and more likely to be narrowed by the programs in in the Achievement Gaps Plan.  This is where the action should be and what we should be watching (if we are only going to watch one level).

If it isn’t already obvious from these charts, the 90% “Proficiency” in five years set as a goal in versions  1 and 2 is a pipe dream, like the Chicago Cubs winning the World Series.  No competent education professional familiar with NAEP cut scores and performance levels and MMSD would put this before the Board of Education for consideration, yet some combination of MMSD administrators signed off on it, twice.  Strike two.

The Next Pitch

I wanted to get this finished and posted before the 11/5 meeting, but I didn’t.  I also wanted to attend the meeting, but it is/was my son’s birthday.  I hope that some of these issues and some others were raised at the meeting (I’ll watch the video and find out).

There are many other issues, like the fact that the AVID section doesn’t appear to recognize that if the other “goals” are reached, the comparison group will be an upwardly moving target; that “Stakeholders” is most often defined as district staff and not students, parents or community members; that the Cultural Responsiveness work has no academic results attached to it; that in Madison — a Union Town — the Career Academy section has no role for organized labor in planning or implementation, but business interests have the best seats at the table (and some will be paid for being there, this is what you expect from Scott Walker, not MMSD);  and to repeat what was said above that much of this is documenting staff being busy and in many key places where measurement of one sort or another is called for the lines are blank or say ‘TBD.”   On this last (with the exception of the ACT where the mandated participation warrants holding off) , the idea of attaching a requirement to have an accountability plan was to have a plan, not a promise to come up with one at some future date.  I could go on (and on), but I think I’ve made the point that the quality of  thought and work that has gone into this by the administration thus far has been lacking in many areas.

It looks like another draft (the third pitch)  will be coming back to the Board on November 26th.   I very much hope that draft is much better than the work we have seen to this point.  I hope it isn’t strike three.  The administrators have demonstrated that they can make corrections when problems are pointed out to them (like the inecusable errors with ACT participation in the first draft), when they get good coaching from the Board.  That is a good thing, but expectations should be higher.  It isn’t the Board’s job to know the distribution of NAEP scores, and it certainly isn’t their job to educate the administration on this (it goes without saying that there is something very wrong when it falls to me — an interested community member  —  to point out their apparent ignorance in the very areas they are being paid to be experts in).   There needs to be some accountability here,  the Board and the community have a right to expect better work.  If we aren’t getting it from those now responsible, we need to find people who can provide it.   The Board is not going to make good decisions without good information. The improvements our students and community need and deserve are not going to happen without competent people at the top.  There needs to be some accountability.  The Board needs to hold the administration accountable , and we need to hold the Board accountable for doing that.

Three Board seats on the ballot in April 2013.  Could be a whole new ballgame.

Thomas J. Mertz

1 Comment

Filed under Accountability, Arne Duncan, Best Practices, Budget, education, Elections, Gimme Some Truth, Local News, nclb, No Child Left Behind, Scott Walker, Take Action, Uncategorized

Opt Out — Just Say No to the WKCE

The Zombies – “Tell Her No” (click to listen or download)

The WKCE testing and related assessments are scheduled for next week in the Madison Metropolitan School District schools (full schedule of MMSD assessments, here), but your child doesn’t have to be part of it.  You can opt out.  Families with students in grades 4,8, & 10 have a state statutory right to opt out of the WKCE; I have been told that it is district practice to allow families to opt out of any and all other, discretionary, tests.  We opted out this year.  In order to opt out, you must contact your school’s Principal (and do it ASAP, (contact info here).

The WKCE does your child no good.  Just about everyone agrees that even in comparison to other standardized tests, it is not a good assessment.  Because results are received so late in the year, it isn’t of much use to target student weaknesses or guide instruction.  There are no benefits for students.

There are also no benefits for schools and the district, and some potential for harm.  The WKCE is central to the new Wisconsin “Accountability” system (discussed here) and will be part of the new “Educator Effectiveness” system, being implemented.  Both of these are built on the — likely false (see: “Snookered by Bill Gates and the U. S. Department of Education“) — promise of  “SMARTER Balanced Assessments,” but because the Report Cards include a “growth measure” and the educator evaluations include a Value Added component, the WKCE will be part of the calculations for at least two more years (this will be accomplished by pretending that the WKCE is essentially the same as the new test, which in fact it likely is, in that it will no doubt measure scocio-economic status better than it measures anything else).

Way back in 2007, a DPI staffer wrote to a Monona Grove School Board Member that:

A large-scale, summative assessment such as the WKCE is not designed to provide diagnostic information about individual students. Those assessments are best done at the local level, where immediate results can be obtained. Schools should not rely on only WKCE data to gauge progress of individual students or to determine effectiveness of programs or curriculum (emphasis added).

But in the mania to compare and rate and evaluate that is the new Status Quo, this is almost exactly how the WKCE is being used.  Not the WKCE alone, but in the Report Cards the WKCE dominates and in the Educator Evaluation the WKCE test scores may be decisive (test scores only account for a small part of the evaluations, but if the other portions show little variance, the test score portion will be determinative).  No good can come from this and the mis-impressions created  —  about districts, schools, educators and students  —  are harmful, if only because they create confusion and make it more difficult to have productive policy deliberations.

I would be remiss if I didn’t acknowledge that opting out can have consequences for schools and districts.  The new Wisconsin system takes away points based on low participation, so there will be an impact there.  If your child is likely to score in the higher ranges, their absence will lower the scores used to produce the “accountability” measures.   If the school consequently falls into one of the two lower tiers,  extended day programs and school improvement plans are required.  If it is in the lowest tier, then the plans must include out-sourcing to an approved “turnaround” vendor.  As I noted before, this is privatization of public services and turnaround specialists do not have records of success that inspire confidence.  A school or district that fails to “turnaround” is subject to further intervention by the State Superintendent.  A school or  that does not cooperate with these directives “will close.”

Although school administrators have criticized the system,  I doubt districts will choose the noncooperation option.  Too bad, that would be a fight that would shine a bright light on the this conception of “accountability.”

Opting out is a smaller version of noncooperation that is available to every family.  You don’t have to be part of the madness.

It can also become something larger. Without all of childrens’ test scores, the machine grinds to a halt.  There is a national Opt Out movement.    Here are some places to find out more (including opt out rights and procedures in other states and districts):

The “Opt Out” page from the National Center for Fair and Open Testing

The Opt Out of Standardized Tests Site

United Opt Out National

Parents & Kids Against Standardized Testing (Facebook)

OPT OUT OF THE STATE TEST: The National Movement (Facebook)

In closing, I want to point to an alternative to the over-use and abuse of standardized testing.  Thee are many;  this one — New York Performance Standards Consortium’s  performance-based assessments — was featured in a Washington Post post, “An alternative to standardized testing for student assessment,” by Monty Niel today.  Check it out.  We can do better.

Thomas J. Mertz

Leave a comment

Filed under Accountability, Arne Duncan, Best Practices, education, Equity, Gimme Some Truth, Local News, National News, nclb, No Child Left Behind, Take Action, Uncategorized

Who cuts the barber’s hair? or Whither “accountability”?

Professor Longhair, “Bald Head” (click to listen or download).

Educational “accountability” is in the news and on the agenda again this week.  It seems it is always in the news and on the agenda these days.  I have many problems with most conceptions of educational “accountability,” especially those that are based largely on standardized tests (a visit to the National Center for Fair  and Open Testing is in order if you don’t agree, or even if you do) and are proudly dubbed “data driven,” (the link takes you to old AMPS posts, Esther Quintero has an important post up on the topic this week at the Shanker Blog: “The Data-Driven Education Movement,” read it).  I’m not going to take on the big concepts here and now, but instead say a few things about the new Wisconsin Report Cards and offer some thoughts about imposing some accountability on those concocting and implementing educational “Accountability” systems, about cutting the barbers’ hair.

The new Wisconsin Report Cards are the product of the “School and District Accountability Design Team” led by Governor Scott Walker, State Superintendent Tony Evers, Senator Luther Olsen, and Rep. Steve Kestell and featuring a decided over-representation of privatizers and deformers (those friends of education at Wisconsin Manufactures and Commerce had a seat), and an under-representation of educators (one teacher, no union reps).  The final version is a centerpiece of  Wisconsin’s successful effort to garner a waiver of  NCLB strictures from Arne Duncan.

A school rating system like this should do three things.  First it should with some accuracy and transparency  rate school quality.  Second, it should honestly and effectively communicate what the rating means and doesn’t mean to policy-makers, educators, parents, and citizens.  Last — and assuming that the ratings are accurate — it should direct appropriate resources to those schools that need improvement.  The Wisconsin system does none of these well.   In fact, because of the complexities of assessing school quality, I don’t think it is possible to do all of these well and know that it is very difficult to do any of them well.  The whole enterprise is in many ways a fool’s errand.

 A recent must-read post by Gene V. Glass for the Washington Post captures some, but not all, of the problems (I’ve touched on the use of NAEP cut scores previously, will be saying more about some other things below and will be writing more on the waiver, the abuse of NAEP cut scores, “accountability,” and “educator effectiveness” issues in the future;  as I was writing this another fine critique came my way, this one from Steve Strieker, called “Another Distractor: School Report Cards,” it is a must read also).

In the introduction to Glass’s piece Valerie Strauss calls the Report Cards “another cockamamie way to grade schools for “accountability” purposes.”  Glass refers to the Report Cards as  “a dog’s breakfast of numbers,” and writes:

The report card for Wisconsin K-12 schools currently making the rounds is a particularly opaque attempt to grade the quality of education that Wisconsin’s children are receiving at the hands of their teachers and administrators. It is as though the Department of Public Instruction has decided to weigh cattle by placing them on a scale to get their weight in pounds then combining that with the wealth of the farmer who raised them, the number of acres of the farm, and the make of car the farmer drives.

The Report Cards combine multiple and often complicated measures in complicated ways.  It takes 62 pages to explain how it is all done.  If in order to understand the choices made you want to dig deeper into the nature of standardized test construction (hint, they are designed to sort students, not measure skills, knowledge or ability), or the controversies over graduation rate calculations, or the limitations of the Student Growth Percentiles ( the link takes you to Bruce Baker posts on SGP and related things) used in the “growth” calculations, or any of the other concepts and tools employed , you are probably looking at  at least the equivalent of a graduate school seminar’s worth of work.   The system fails the transparency test.

All this information is interesting, but what it means for any particular school or district is far from clear, even after the graduate seminar and that’s how it should be, that’s reality…all the test score data, and graduation rate data, and attendance data in the world isn’t going give you a full and true picture of schools and districts.  That’s the first way it fails the accuracy test, a little more below.

With “accountability”  the order of the day, the “accountability” mavens know that people want something easily swallowed (if not digested), so the Wisconsin team has given each school a score, based on those calculations that take 62 pages to introduce.   That score is what everyone looks at, everyone remembers and everyone seems to think has some profound meaning.  What you really have is a Rube Goldberg machine of black boxes inside black boxes that spits out a number.  That number hides all the questionable choices in the measures and manipulations, as well as all unmeasured and unmeasurable things that contribute to or detract from school quality.  Some in Wisconsin were proud that we didn’t assign letter grades like Florida has, but the number is just as bad, or even worse because superficially something like 66.7% seems to have more scientific accuracy., an a B-.  It doesn’t.   Superintendent Tony Evers and others have said many of the appropriate things about over-interpreting the scores given schools, but they put the score there and because of the inclusion of the score, the system fails the communication test.

This failure reminds me of the misuse of NAEP cut scores that is central to the accountability system, used for sorting individual students and in the growth scores sores that only recognize movement between NAEP based levels, not within them.  This is what the National Academy of Sciences publication, “Grading the Nation’s Report Card: Evaluating NAEP and Transforming the Assessment of Educational Progress,” says about these cut score in chapter 5, “Setting Reasonable and Useful Performance Standards (I’ve quoted this before here, “The news from Lake Gonetowoe“):

Although standards-based reporting offers much of potential value, there are also possible negative consequences as well. The public may be misled if they infer a different meaning from the achievement-level descriptions than is intended.  (For example, for performance at the advanced level, the public and policy makers could infer a meaning based on other uses of the label “advanced,” such as advanced placement, that implies a different standard. That is, reporting that 10 percent of grade 12 students are performing at an “advanced” level on NAEP does not bear any relation to the percentage of students performing successfully in advanced placement courses, although we have noted instances in which this inference has been drawn.) In addition, the public may misread the degree of consensus that actually exists about the performance standards and thus have undue confidence in the meaning of the results. Similarly, audiences for NAEP reports may not understand the judgmental basis underlying the standards. All of these false impressions could lead the public and policy makers to erroneous conclusions about the status and progress of education in this country. (Emphasis added)

The NAE-based cuts scores (WKCE scores “mapped” to NAEP are also being used with the results of individual students.  Here’s what the people at NAEP say about that:

Does this mapping method allow us to link student scores received on state test to the NAEP scale? If not, why not?

No, student scores cannot be linked to the NAEP scale because the NAEP does not generate reliable scores at the individual student level, only average scores for groups of students (e.g. males, females).

I would hope that at least the DPI staff working on the “Accountability” system knew this.   If they didn’t, that’s a problem; if they did and went ahead anyway, that’s a bigger problem.

In terms of accuracy, the Report Cards do one thing well, they sort schools by their relative poverty.  Here is what Gene V. Glass wrote on this:

What emerges from this dog’s breakfast of numbers? A measure of the wealth of the community in which the school is located. The correlation between the OAI and the “% Economically Disadvantaged” in the school is nearly -.70. That means that the poorer the children in the school, the lower is the school’s number on the Overall Accountability Index; and the relationship is close. In fact, a correlation of .70 is even tighter than the relationship of adults’ height to their weight, and both measure a person’s size. So what the DPI has created is a handy measure of a community’s wealth (SES, Socio-Economic Status) without ever having to ask anyone their income.

Steve Strieker observes that this isn’t news to many of us:

DPI’s own school report card data proves what Social Context Reformers have been trying to highlight for years: Poverty is the eight ball for public education.

Even an amateur’s analysis of the state’s school report card data is telling.

  • A supermajority of Wisconsin’s public schools with over 70% economically disadvantaged students were graded “Failed to Meet Expectations.”
  • Almost all below-standard schools had at least 45% economically disadvantaged students.
  • In contrast, almost all graded schools with less than 10% economically disadvantaged students were considered by DPI’s measurement to surpassed expectations.
Social Context Reformers must not be shouted down by the “no excuses” reformers who will surely shame Wisconsin schools graded below expectation by showcasing the few schools with high poverty rates and high-test scores.

Given this pattern and what we know from 1,000 sources, the remedy should be to provide additional, appropriate help to high poverty schools.  We didn’t need the Report Cards to tell us that.

Unfortunately the new system fails this test too.  Most of “help”  under the new system is directed to Title I schools.  In theory, Title I schools are high poverty schools, but not all high poverty schools are Title I.  In Madison and some other districts, for reasons I’ve never understood, only pre-K-5 schools are Title I, which means that no matter how high poverty (or low scoring) middle and high schools are left out.

In this case, that is probably for the best, because the “help” being offered appears to be more of a diversion of resources than an addition.  No extra resources will be provided and some of the scarce resources available must be reallocated to questionable purposes.

The “Schools Below Expectations, and Significantly Below Expectations”  will be required “to submit a plan detailing the extended learning opportunities for eligible students.”  And:

[S]chools must participate in an online district-directed diagnostic review of the current core reading and math curriculum including interventions for struggling students. The school must develop an improvement plan based on the diagnostic review, and implement RtI, working closely with the Wisconsin RtI Center. Specific interventions in the plan must address identified problem areas. The plan must be approved by DPI…o DPI will conduct electronic reviews of each school’s progress and monitor throughout the year.

So extended learning, an online review, with an online plan, and online monitoring.

For “Schools Persistently Failing to Meet Expectations” extended learning is also mandated, the diagnostic review will be onsite,  and also must result in an approved plan.  But there is a kicker, and the name of that kicker is privatization: “Schools must contract with a state-approved turnaround expert/vendor to implement reform plans aligned to the diagnostic review.”  In other words, schools have to take money from the classrooms and give it to the likes of Paul Vallas and hope for the  best (here is a selection of posts on “turnarounds” from Diane Ravitch, read them to understand my skepticism).  And when the turnaround fails, as they almost always do, here is what happens:

o For public schools that do not participate in the diagnostic review, improvement planning and interventions with turnaround experts, they will close.
o For schools that do participate but fail to show demonstrable improvement after three years, the State Superintendent will intervene. Pending legislation, in the case of schools participating in the Parental Choice Program, the state will remove the school from the program. In the case of charter schools, the authorizer must revoke the charter.

Arne Duncan has always liked school closings.  I think it is safe to say that the system fails the “direct appropriate resources to those schools that need improvement” test also.

Superintendent Tony Evers also has some school finance proposals that he has been touting.  Unfortunately, his Fair Funding for Our Future plan does not include directing any extra resources to high poverty schools or even those identified as in need by this accountability system.  The Fair Funding plan does some good things, but addressing poverty is not one of them.  For years the only state program directing resources to classrooms  based on poverty is the Student Achievement Guarantee in Education or SAGE), which only targets the early grades and in budget cutting moves over the last few years, done under the rhetoric of “flexibility” has been eroded by larger allowed classes and new allowances concerning the grades covered.  There does not seem to be any desire to change that, either from DPI or the legislature.

Fair Funding claims that it “Accounts for family income and poverty.”  In sense it does, but via tax relief for property owners, not by giving schools serving students in poverty the resources they need to meet their challenges.  Under Fair Funding student poverty levels will be factored into calculations of state aid,  but revenue limits will not have a poverty bump and there is no new categorical aid for students in poverty.  So property taxpayers in districts with higher poverty will have lower taxes and the schools will not have an extra penny (btw –the Penny for Kids proposal from the Wisconsin Alliance for Excellent Schools/ Opportunity to Learn Wisconsin includes a poverty based categorical aid).  So the Widow Hendricks of “divide and conquer” fame who owns property in multiple high poverty districts gets a tax break and the students of Beloit and Janesville get nothing.

Back to the titular questions,  who cuts the barber’s hair?; who holds the people behind this mess created in the name of “accountability” accountable?  We all need to.

Start at the top.  For Arne Duncan, join the thousands who have signed the “Dump Duncan”  petition.  There is also an election on November 6th and Duncan’s boss Barack Obama is up for re-election.  Diane Ravitch has made a case that “as bad as the Obama education policies are, they are tolerable in comparison to what Mitt Romney plans.”  Others concerned with education, especially those not in swing states, should take a good look at Jill Stein.

In Wisconsin, for Senate and the House, more-or-less the same situation exists.  Some version of NCLB/ESEA will certainly be before Congress, and for that all of the Democrats on the ballot are better than the Republicans, but none have distinguished themselves on Education issues the way Russ Fiengold did.  Still, I’ll be voting for Tammy Baldwin and Mark Pocan and urge you to do the same.  I’ve already warned Mark that I’ll be contacting him regularly on Education and other issues and calling on him be more of a progressive champion on this blog, just as I have when he was my State Rep.

That’s another version of accountability.  It starts at the ballot box, but it doesn’t end there.  Our elected officials need to here from us, all the time.  They need to know — as we sing at the Solidarity Sing Along   — “We’re not going away.”

At the state level, we don’t get another crack at Scott Walker this year,  but there are State Senate and Assembly races.  Again, the rule is Democrats better than Republicans, but there are also some Democrats who are not only better than Republicans, but are real supporters of education.    The two I’d like to point to are Melissa Sargent (who is a good friend) and Mandela Barnes (who I have admired from afar).   By all accounts the Senate is the key this time around.   The key races where your support ($$$ and time) may make difference appear to be Susan Sommer, Jessica King,and Dave Hansen.  Keeping the Senate is the best way to keep Walker in check.  With all this, it is important to remember that the “Accountability” system has been presented as a work in progress and there is some legislative power to dictate changes in some areas (the Report Card portion did not require legislative action, but other parts of the waiver did), and that any changes to school funding — good or bad — have to go through the legislature.  With the State Legislature, this time around accountability means at minimum limiting the power of the Walker allies who aided in the creation of the “Accountability” system.

I’ve saved Superintendent Tony Evers for last.  He is up for re-election in April 2013 and as with all elected officials, the best place to assert accountability is at the ballot box.   It is also likely that come April, Evers will be the better choice (I supported Todd Price in the Primary last time and Evers in the General Election against Rose Fernandez).  Also as with all elected officials,  imposing accountability includes making sure Evers hears from the voters throughout his term, both positive and negative, and I hold some hope he may listen and adjust his course.

There is much I like and admire about Evers, but as the above indicates there are many things he has pushed that I think are bad, wrong or at very least should be better.  I understand that most of this was done in the context of a state in the control of the Fitzwalker gang and a federal policies set by Arne Duncan.  Given the circumstances, it is impossible to tell which things he truly believes are good for our state and our students and which are pragmatic choices made in order to keep a seat at the table and maybe deflect even worse policies (one example where I believe he did this was the mandated grade retention that Walker initially wanted in the Read to Lead legislation).  This situation keeps bringing to mind something Anthony Cody wrote recently about teacher leaders:

How can we make sure that we are not being used as tokens? For this, we have to look at why we are being asked to join the conversation. What are the power dynamics at play? Do we have a vote when decisions are to be made? Will we find allies around the table to help us have some influence? Do we have any real cards to play? This gets us closer to defining what real leadership is all about. Real leadership is not just the ability to speak with clarity and authority based on our experience in the classroom. It also involves a relationship to other teachers, and to some level of political power in these situations.
And Cody concludes:
The bottom line is that we do not have the money to buy influence. We have to get it the old-fashioned way. We have to organize for positive change at our school sites. We have to join with others at our union meetings, and as our colleagues in Chicago showed, we may need to go on strike. We have to build strong relationships with our colleagues, with parents, with allies in other unions and social movements, and with reporters, and use this strength as the basis for our ability to speak for ourselves. We have to organize and build our strength from the ground up, because the strength that comes from the top down is like the strings on a marionette.
As I said, I don’t know what parts of the Waiver or Fair Funding or other things Tony Evers truly believes in, but I have a feeling that he has misgivings about some of these.  For those I urge him to give up the seat at Scott Walker’s and Arne Duncan’s  table (he is after all a State Constitutional officer, with his own table) and take Cody’s advice to “to build strong relationships with our colleagues, with parents, with allies in other unions and social movements, and with reporters, and use this strength as the basis for our ability to speak.”  Till that happens he shares in the accountability for the “accountability” system.

Thomas J. Mertz

Leave a comment

Filed under "education finance", Accountability, Arne Duncan, Budget, education, Elections, Equity, finance, Gimme Some Truth, Local News, National News, nclb, No Child Left Behind, Pennies for Kids, School Finance, Scott Walker, Take Action, Uncategorized

Expeditionary Learning Charter for Toki?

The Replacements – “I Don’t Know” (click to listen or download).

The biggest item on the Madison Metropolitan School District Board of Education committee agendas this week is  the “Expeditionary Learning Model at Toki Middle School and Timeline” before the Planning and Development Committee (Monday, October 15, 2012, 6:30 p.m. Doyle Administration Building, Room 103, there are Public Appearances on the agenda).  The proposal is to convert Toki Middle School from a district  school to a district instrumentality charter school.

This is the start of a long process of weighing the pros and cons of the proposal, with various decision points along the way.  If the proposal gets that far, the final decision by the Board would be in early 2014 and if the vote is for approval the conversion would happen in September of that year.

Having first seen the proposal only a couple of days ago, I have many questions, concerns and observations, but am nowhere near having decided whether to oppose this.  For the record, that’s exactly where I was at at this point with both Badger Rock (which I did not oppose) and Madison Prep (which I did).  Also for the record, I can’t see myself actively supporting any charter school proposal (it could happen, but it is doubtful).  Mostly I see charters as a distraction from improving the district schools that will for the conceivable future continue to serve the vast majority of students (see this recent post from Deb Meir for some related thoughts).

So on to the “questions, concerns and observations.”

A desire for Federal money appears to be driving the decision to seek a charter.

I’ve written about this before (worth rereading, really), but have never seen such a transparent example.  Some excerpts from the documents, first from the introduction by the district administration (the pdf doesn’t cut-and-paste as text, you can click on the images to enlarge):

Note the “do more with less,” and the “need to look beyond the District allocation process” and remember that in the recent past MMSD has not used the full levy authority available and that the administrative recommendations to not use the full levy authority have been accompanied by assurances that the quality of education was not suffering due to the lack of resources.  If that was true, then the statements here aren’t.

From the proposal itself:

More references to “budget constraints” past and anticipated in the future.  A distinction should probably be made here that there are two related parts to the proposal.  One is the proposal to continue and expand Expeditionary Learning at Toki (more on this below) and the other is to do this as a Charter School.  It is clear that the desire to do the Expeditionary Learning is strong among some, and that chartering is primarily a financially driven means to that end.  Here is what I wrote previously about these aspects of chartering:

The “we can’t do it without a Charter” attitude seems lazy.  First I’d like to know in some detail why it supposedly can’t be done without a Charter.  If that proves to be the case,  than in most instances wouldn’t the best policy be to figure out why and change things so that the benefits of innovation could be achieved through district programs?  It is sad that so many have given up on the reforms that would benefit all students in order to pursue those that will only touch very few (even the staunchest Charter advocates understand that for the foreseeable future the vast majority of American children will attend district schools).

I’ll offer one answer to the titular question: Money!  Unfortunately Federal policy-makers, foundations and many others are all acting on the unexamined assumption that innovation or even diversity of educational programing requires Charters.   I have a friend who is a Superintendent of a small district.  He is justly proud of an environmental Charter school he helped create.  We’ve never talked about it much, but a  couple of months ago he started describing how the only reason to have it be a Charter was the money.   This is pragmatic, but it only shifts the question to “Why is money available for Charters and not district-based creative programs?”

In the bigger picture, with Race to the Top (and the NCLB waivers), we have seen how chasing Federal money has led to less than stellar education policy-making.  Much less than stellar.

The budget numbers assume maximum Federal Grants.

I don’t know if this is realistic.  In order to qualify for the maximum, the Charter must have at least 50% free/reduced lunch enrollment.  That has been the case with Toki only one of the last 11 years (2010-11).  Beyond that, I’m not clear if the maximum grants have changed recently or if DPI awards grants below the maximums, but I do know that no grants given in 2012 were this large.

The dollar amounts cited in the proposal are over three times as large as those cited in a previous request.

On January 31, 2011 the Board was presented with a funding appeal (apparently directed at private donors) for Expeditionary Learning exploration and implementation at Toki, with a 4 year budget that totaled $310,000.  In the pending 2012-13 budget MMSD will provide $60,000 for planning.  It would be good to know why the numbers have changed.  The proposers are probably correct that MMSD can not fund $975,000 for their purposes, but another $250,000 ($310,000 minus $60,000) over 2-3 years is possible.

At this point there is no indication of what the ongoing costs will be.

That’s fine, that information is required at later points in the process, but being aware that there may be extra costs that continue after the Federal money goes away seems wise.

They appear to be proposing a school that is both a charter and and an attendance area school.

On page 13, the proposal says the Charter School students will be “reflective of the current neighborhood,” that “all students within the Toki attendance area will attend,” but also includes references to a lottery to meet numbers.   I would assume that some arrangements would be made for attendance area students who do not want to attend the Charter School, who would prefer to have the policies of their school set and implemented by an elected Board of Education instead of a self-selected Governing Board.

The research cited on Expeditionary Learning is less than convincing.

The proposal (in a very sloppy manner) cites three  studies and one meta analysis in support of Expeditionary Learning as a means of addressing persistent gaps in achievement.  I’m reproducing this entire section below in order to emphasize the centrality of achievement gaps  to the proposal and what the research claims are:

The research citations here seem to come straight from the Expeditionary Learning organization that would be in line to receive most of the $975,000 being requested, so it seems worth looking a bit closer (it is also worth noting that the three studies all appear to have been commissioned by that organization, although I am not 100% sure of that).

Another important caveats is that these are all based on standardized tests and those offer very limited insight into school quality.

Two of the studies  — “Expeditionary Learning: Analysis of impact on achievement gaps,” and “Impact of the Expeditionary Learning model on student academic performance in Rochester, NY” — were done by the Donahue Institute at UMass.  I can’t find the first online, but both were submitted to the What Works Clearinghouse and found not to meet their standards for review.  More on the Rochester study below.    The third study — “The relationship between Expeditionary Learning participation and academic growth” — was done by Mountain Measurement (analysts for hire) and includes few — if any — schools comparable to Toki 9more on this study below, also).  The meta analysis is from 2002, focused on whole school reform models (not achievement gaps  or Expeditionary Learning) and categorized Expeditionary Learning among the programs that were “Highly Promising…but did not have research bases that were as broad and generalizable as those of the models that met the highest standard.”

The Rochester study includes two Expeditionary Learning schools.  The Genesee Community Charter School, serving grades K-6, with a Free/Reduced Lunch rate of 17%, and 0% student mobility,  18% African American, 9% Hispanic, 2% ELL (can’t find Special Ed numbers).  For all these reasons, I don’t see it as comparable to Toki (grades 6-8, not a charter, 48.9% Free/Reduced, most recent mobility factor of 15.8, 28.1% African American, 13.8% Hispanic, 11.5% ELL, 16.4% Special Ed).  the other is the World of Inquiry School.  This is not a Charter, but it may be a magnet or choice school (there is an “Admissions” page on the website, but the click through ends up at a page that isn’t working).  World of Inquiry is a K-8 school, and appears to face similar challenges as Toki, some more pronounced (63% Free/Reduced, 76% African American, 9% Hispanic, 3% ELL).  I’ll be returning to World of Inquiry.

The first part of the report on the Rochester schools cited in support of Expeditionary Learning seems legitimate, as far as it goes (I’d like more details on some of the steps and choices). It is a “quasi-experimental design, involving matching students in Expeditionary Schools with students in other schools by various characteristics (poverty, race, ELL, gender, grade, special education status).  There is some manipulation around the score distributions, involving a regression analysis of the various characteristics, but the regression coefficients aren’t given.   The found statistically significant, positive effect sizes for reading across the board, and in math only for elementary school.  Here’s the table:

Statistically significant doesn’t always translate into significance for policy.

The next step in the attempts to address this by converting the effect sizes into “implied shifts” in proficiency percentages.   The shifts in some of the categories (the same ones as the above chart) are large — about a 30% gain in proficient students for middle school reading in 2007-9, for example and bigger gains with elementary (along with losses for middle school math — so large that they make me doubt the whole analysis. remember that it did not meet the Department of Education’s What Works Clearinghouse standards.   I’ll look closer later and consult with people who know more about quantitative work than I do (as I said at the top, this is going to be a long process), for now I want to keep this in mind and shift to looking directly how middle school students at World of Inquiry have been doing.

The short answer is, not very well, worse than Toki.  No doubt at some point in the future I’ll produce nice charts and graphs on this, but here’s the quick and dirty numbers, only one year (2010-11), one grade (8th), and only Reading, percentages proficient or better (Toki data from WINNS, World of Inquiry data from here):

Reading Toki Reading WoI
All Students 77.50% 46.00%
African American 64.70% 39.00%
Hispanic 72.20% 63.00%
ELL 42.90%
Special Ed 40.00% 0.00%
Free/Reduced 64.20% 43.00%

Note that state proficiency measures vary greatly, according to the NAEP mapping project, Wisconsin’s are lower than New York’s.

In every category, World of Inquiry is doing worse than Toki, far worse.   This raises many questions about all the promises made in the proposal.

Even quicker and dirtier on the “The relationship between Expeditionary Learning participation and academic growth” report.  It is a similar quasi-experimental design, but includes many more schools and students.  Some are rural, some are suburban, some are charters, some are private, some are k-5, some include 6-8…only two seem to be comparable at all to Toki.  MAP testing is at the center of this study, for what that’s worth.  The results are all over the place (as they probably should be).  I haven’t had time to dig into it too much, here’s the summary table:

Again, much here that doesn’t support the confidence of the citations or tone of the proposal.

King Middle School  in Portland,ME seems to be one of the more comparable schools in this study, and one that many supporting the proposal seem to be pointing to as an example of success.  It isn’t exactly comparable, having similar poverty numbers, but much different racial and ethnic percentages (more on that at another time)  With that in mind, here is another chart comparing Toki and King (same years, grades…as above, King data from here):

Reading Toki Reading King
All Students 77.50% 78.00%
African American 64.70% 46.00%
Hispanic 72.20%
ELL 42.90% 47.00%
Special Ed 40.00% 38.00%
Free/Reduced 64.20% 64.00%

Note that state proficiency measures vary greatly, according to the NAEP mapping project, Wisconsin’s are lower than Maine’s.

Students at King seem to be doing roughly the same as students at Toki, with African American students doing substantially worse.

These initial forays into the research and data find little or nothing to support the implementation of Expeditionary Learning (with a charter or otherwise) as the solution to the challenges and struggles Toki has been facing.  There is much more to be done before a firm conclusion either way is arrived at.  I hope that unlike with Madison Prep, the MMSD administration does their duty to thoroughly analyze the educational aspects of this proposal, so that the Board and the community have something more than my explorations to go by.

Closing

There are many other concerns and questions I have at this point, these include the present and future roles and thinking of those Toki staff members who don’t support the initiative, the way this all interacts with the recently approved Urban League program, how people at Toki came to champion Expeditionary Learning (and how much independent research have they done or looked at), why the “Equity” section of the administrative portion is blank …many, many questions and concerns.  Plenty of time to air them; this is a long process.

I want to close by saying that I admire those behind this proposal for working to improve their school, for not accepting the frustrations of seeing students struggle and fail, for taking the initiative to find a way to try to make things better.   I may not end up agreeing that the way they have chosen is a good way, a way worth trying, but that doesn’t change my admiration.

Thomas J. Mertz

1 Comment

Filed under "education finance", Arne Duncan, Best Practices, Budget, education, Equity, finance, Local News, nclb, No Child Left Behind, School Finance, Uncategorized

The news from Lake Gonetowoe

On the agenda at tonight’s (08/13/2012) Madison Metropolitan School District Board of Education Student Achievement and Performance Monitoring Committee meeting (5:00 PM, rm 103, Doyle Building) is a presentation on the first year Measures of Academic Progress (MAP) scores in MMSD.  Explicitly and implicitly this presentation makes assumptions about test scores, cut scores, standards and achievement that are both wrong and dangerous, creating what I am calling the Lake Gonetowoe Effect, the inverse of the Lake Wobegone Effect, which posits “all the children are above average.”  In Madison we’ve decided that only half the students in the nation are “proficient,” while retaining the idea that all of our students should be “above average.”  The worst of both worlds.

 Matt DeFour’s State Journal story on the MAP scores emphasized that these test scores offer another way to document achievement and gaps in the district.  That’s not what this is about, but a few words before moving on.  Whether they are a better or more accurate measure than the ones used previously is an open question.   MAP is designed as a diagnostic, to be used to help teachers better identify their students’ weaknesses.  From my conversations with teachers, it appears that little or no professional development was done prior to implementation in MMSD.  Unlike Kansas City, for example, where “teachers in the district” were reported “drilling students for the test… practicing like a team would before a big game,” in Madison the tests stood largely outside of instructional practices.  This makes a difference, especially since changes in scores from Fall to Spring are a big part of the report.  If other districts are using the Fall results to “teach to the test” in preparation for the Spring tests and we aren’t, then it it would be expected that MMSD students would show less change.  Some more (and different critiques of MAP here).

I also need to insert the usual caveats about all standardized tests being of limited utility in understanding students, their teachers, their schools and their districts.

Both the grade level benchmark scores and the growth measures in the MMSD MAP presentation are based on the national sample of MAP test takers and are “normed” to match the demographics and school characteristics of the United States school population as a whole.  The demographics and school characteristics used to norm are  different from those found in Madison and different in ways that are associated with lower achievement, yet there seems to be a sense that our students should out-perform the national norms.  There are no published national MAP mean scores broken out by subgroup, but this from a MAP pilot in Montgomery County (MD) Public Schools has some interesting data to look at by way of comparison (not direct with the MMSD presentation, different measures were used).  That’s certainly something you want to work for, but it also leads to unrealistic expectations.  At the national level a majority of students, much less ‘all students” can not, by definition, be “above average.”  To expect a majority of students in MMSD to be above average doesn’t help in any way.  High expectations are one thing when used in a classroom to motivate and inspire students,; they are something else all together when analyzing data and making policy.

This conflation of high expectations in the classroom with higher cut scores on standardized assessments has led to the Lake Gonetowoe Effect on display in the MMSD MAP presentation.  The explicit move in this direction comes in the section comparing NAEP to the WKCE:

Comparing MAP to WKCE. Proficiency bands of advanced-proficient-basic-minimal for WKCE are established by DPI. To provide a comparable look at results, similar proficiency bands are calculated for MAP by MMSD staff. The national mean is used to mark the difference between Basic and Proficient. Students that are more than one standard deviation from the average are at the Advanced level. Students that are more than one standard deviation below are at the Minimal level.

I’m going to leave the parts about setting other cut scores via one standard deviation aside in order to highlight the definition of proficient as equal to or above the score attained by exactly one half of the normed national sample.  With that definition they label 1/2 of the nation’s (and more than 1/2 of MMSD’s) students as failures.  And this isn’t based on some platonic ideal of what students should know, it is an absolutely subjective and even arbitrary choice (all cut scores are subjective, but few seem this arbitrary).  The weird thing is that the people who produced MAP have done sophisticated alignments of  achievement levels to various state standards and tests, including the WKCE, so this wasn’t necessary.

I think it is a reflection and extension of something larger, and potentially destructive (I don’t think this was the intent, but rather that those who prepared the presentation have internalized all of the reformy messages around cut scores and did this without thinking). The big idea seems to be that if we set cut scores for “proficient” at a level few students will attain, then somehow more students will attain that level in the future.  Raising the bar via high cut scores does not help students learn.  I guess it is easier than looking at the systematic inequality, or asking what resources are need to help kids learn and then providing them.  It certainly distracts from those kind of things and as a bonus plays into the “our schools are failing” bash the teachers, bash the “status quo,” “burn the village in order to save it” mentality of many “reformers.”

This can also be seen in the adoption of the very problematic NAEP based cut scores by DPI in the new Wisconsin “accountability” system,” Many of the issues with the NAEP cut scores are detailed in the National Academy of Sciences publication, “Grading the Nation’s Report Card: Evaluating NAEP and Transforming the Assessment of Educational Progress,” especially chapter 5, “Setting Reasonable and Useful Performance Standards.  Read the whole thing.  Here’s the money quote from the intro:

In addition, the public may misread the degree of consensus that actually exists about the performance standards and thus have undue confidence in the meaning of the results. Similarly, audiences for NAEP reports may not understand the judgmental basis underlying the standards. All of these false impressions could lead the public and policy makers to erroneous conclusions about the status and progress of education in this country.

Are you listening Chris Rickert?  How about you, Superintendent Tony Evers?   Good, while I have your attention, surf on over to Jay Bullock’s Using NAEP cut scores devastates, disserves our students to get the view from the classroom on the Lake Gonetowoe Effect.

I understand the problems with cut scores that are set so low that they little of use in identifying varying degrees of achievement and create unearned good feelings.  Many states did this in order to avoid the forced and unproductive reforms associated with NCLB sanctions.  The pendulum appears to be swinging in the other direction and we seem to be entering the era of where cut scores
are designed to inspire reformy Jeremiads (if not actual learning).   I hope our stay at Lake Gonetowoe is short, because it isn’t going to be pleasant or productive.

Thomas J. Mertz

Leave a comment

Filed under Accountability, Arne Duncan, Best Practices, education, Gimme Some Truth, Local News, National News, nclb, No Child Left Behind, Uncategorized

Who is Paul Vallas and why is he coming to Madison?

Photograph by AP/Worldwide Photos

As Jim Anchower says, “I know it’s been a long time since I rapped at ya…” Sometimes you need a break; expect more soon.

Paul Vallas will be featured at a “school reform town hall meeting” this Saturday, May 26, 1:00 PM at LaFollette High School.  The announcements feature “Madison Metropolitan School District, Verona Area School District, United Way of Dane County, Urban League of Greater Madison & Boys & Girls Clubs of Dane County” as “collaborating” hosts, but as reported by Matt DeFour the United Way  “has requested that our name be removed from all upcoming communications related to the event, but will attend to hear the conversation from all those involved.”

Attempts to clarify MMSD’s role have not yielded a response.  You can try yourself:  Board of Education: board@madison.k12.wi.us, Supt. Dan Nerad: dnerad@madison.k12.wi.us.  I’ve been told unofficially that MMSD is donating the space, which would mean that your tax dollars and mine are being used (see the district facilities rental policy here).  It would really be a shame if our district collaborated in bringing Vallas here, there is very little in his version of school reform that our community, or any community will benefit from.

I can’t answer why he is coming to Madison.  I presume that those who are bringing him would like to see Madison adopt the policies Vallas favors.

I can and will say some things about who Vallas is.  As is common with these things, it depends on who you ask.  The Koch and Bradley funded Manhattan Institute anointed Vallas with their Urban Innovator Award for 2006 (other recipients include Michelle Rhee, Jeb Bush and somewhat inexplicably Jerry Brown).   The (also Bradley funded) Heartland Institute has had consistently good things to say about Vallas.  You might recall that they are the ones with the secret “Operation Angry Badger” plan to “help defend and secure” the rule by the FitzWalker gang.   On the other side, at the Daily Censored, Danny Weil called Vallas “”vassal and executioner of public schools.”

The Wikipedia entry provides a fair if spotty overview of his career.  Here’s a short version.  When Chicago Mayor Richard M. Daley was given control of the Chicago schools in 1995, he appointed then City Budget director Vallas as CEO.  Vallas served till 2002, when disappointing progress the defeat of a Vallas friendly slate in the teacher union election led to his resignation (and here).  He ran unsuccessfully in the Democratic primary for Governor losing to Rod Blagojevich. From there it was to Philadelphia, where he served under the State appointed School Reform Commission from 2002 to 2007 and oversaw (among other things) what was then “the nation’s largest experiment in privatized management of schools.”  He flirted with other Illinois Gubernatorial runs in 2005 and 2008, and the Cook County Board President in 2009 as a Republican (prompting the question, what kind of person became a Republican between 2008 and 2009).  Vallas then became head of the State administered and Charter dominated Louisiana Recovery School District (RSD), where he served from 2007 until 2011.  The RSD is now unquestionably the largest school privatization effort in US history (see this great video of a parent complaining that when Charters are the only choice, there is no choice, more here). More recently he was tapped by an illegally appointed Board as interim Superintendent in Bridgeport CN.  His $228,000 salary is being paid for by the private Bridgeport Education Reform Fund.  Not surprisingly, Vallas’ plan for Bridgeport includes extensive blurring of the line between public and private.  It should probably be mentioned that Vallas’ resume also includes well compensated activities in Chile (leading to mass protests against the reforms he brought) and Haiti on behalf of the Inter-American Development Bank.

A couple of things stand out in his career.  One is that he’s never worked with a locally elected education authority (ie an elected School Board); the other is that privatization is prominent in his toolbox.  He explained the former to New York Times reporter Paul Tough:

When I asked Paul Vallas what made New Orleans such a promising place for educational reform, he told me that it was because he had no “institutional obstacles” — no school board, no collective bargaining agreement, a teachers’ union with very little power. “No one tells me how long my school day should be or my school year should be,” he said. “Nobody tells me who to hire or who not to hire. I can hire the most talented people. I can promote people based on merit and based on performance. I can dismiss people if they’re chronically nonattending or if they’re simply not performing.”

On the latter, a quote from an article Vallas wrote for the aforementioned Manhattan Institute:

We also have flexibility when it comes to work rules, which are decided by the board rather than the state. This has allowed us to do a lot of privatization. Our alternative schools are private schools, as are many of our special-ed schools. Our vocational education programs are also privately run to some extent. And we have contracted out for custodians, lunchroom attendants and the trades. In our system, schools have a choice. If they are not happy with their in-house services, they can privatize them. There’s competition.

It should be added that privatization also includes extensive pinstripe patronage contracts, something Vallas himself is now taking advantage of via his consulting company, winning a $1 million dollar contract that brings him back to the Chicago scene and raising some questions of transparency and conflicts of interest in Rockford).

From these quotes, it is also clear that Vallas would prefer not to have to deal with unions either.  In Chicago and Philadelphia, Charter School expansion helped limit the union presence and Vallas also moved to replace other union workers — such as custodians and food service employees — by contracting with private companies, resulting in lost benefits.  Like many of the market-based school reformers, Vallas talks a good game about addressing the impacts of poverty via education while making it harder for the working poor in his employ to provide for their families.

Vallas also likes tests, a lot.  As in Philadelphia, One of the first things Vallas did in Bridgeport was to institute an extra round of standardized tests and the reason given was that “Traditionally, instruction wanes after the administration of the state tests.  Unfortunately, this “lull” in teaching and learning deprives our students of much-needed academic support.”  This echoes what Vallas said about test-based accountability in Chicago:

Vallas does not see fear as a negative. “My first reaction is that we went for decades of no fear, and where was the creativity then?” he asks, irritation rising in his voice. “Fear is a consequence of poor performance.

“People who are afraid may not have the makeup to move schools forward,” he adds. “A majority of teachers and principals have a lot of confidence in what we are doing and are delighted that we are focusing on raising student achievement.”

The use of fear was part of the picture in Philadelphia for educators and for studentsVallas is also a fan of test (and fear) based evaluations as a basis for teacher employment.

Fear, tests and transparency all came together in Vallas $1.4 million lawsuit against Chicago teacher and Substance reporter George Schmidt, who had published flawed test items from the Vallas initiated Chicago Academic Standards Exams.  Well before Pinapplegate, Schmidt was blowing the whistle on bad tests.  As he details here, his reward from Vallas was the loss of his job and years spent fighting the suit (and to keep Substance going), but was ultimately vindicated when the monetary damages claim was reduced to $0.  Substance is still going strong.

Discussion of testing inevitably leads to discussions of test scores and much of Vallas reputation rests on his reported gains in this area.  Leaving aside the limited utility of standardized teats as a measure of learning or teacher or school or district (or CEO) quality a closer look at Vallas’ record in Chicago does not indicate marked improvement and it is likely that a similar analysis for Philadelphia would also deflate the grandiose claims.  The Consortium on Chicago School Research (CCSR) report “Trends in Chicago’s Schools Across Three Eras of Reform”  This report”addressed the problems in the public statistics by carefully constructing measures and methods to make valid year-over-year comparisons…to create an accurate account of the progress made by CPS since the early 1990s.”  Some of the problems addressed had to do with changes in tests and cut scores, others “not only other changes to the test format, testing conditions, and scoring methods, but also changes in school policies—grade promotion standards, testing policies, and eligibility around bilingual and special education services—and shifts in the types of students being served by the schools.”

I want to point to the “grade promotion” or retention policies as a particular area of importance.  In both Chicago and Philadelphia, Vallas instituted test-based retention policies (an idea so bad that even Scott walker was convinced to abandon it).  Retention’s positive impact on test scores is akin to CEO’s concentrating on quarterly profits and not the big picture of long term health.  Students in third grade the second time around will post higher third grade scores, but the gains are temporary and they are more likely to drop out and suffer other negative outcomes (you can read about the Chicago Civil Rights action on retention here and here and more from Philadelphia here.).

What the CCSR found in general was that “Many of the findings in this report contradict trends that appear in publicly reported data. For instance, publicly reported statistics indicate that CPS has made tremendous progress in elementary math and reading tests, while this analysis demonstrates only incremental gains in math and almost no growth in reading.”  The same pattern is true for the Vallas years, some slight improvement in some reading scores, and slight but more pronounced improvements in math scores.  Large racial gaps grew, Chicago continued to lag behaind the state and “Despite progress, the vast majority of CPS students have academic achievement levels that are far below where they need to be to graduate ready for college.”  It should also be noted that graduation rate improvements slowed under Vallas.  The whole report is worth a read, especially the section on “Changes in School Climate and Organizational Supports,”

No equivalent analysis has been done for Philadelphia, but there is reason to doubt the reported double digit and even 20%+ increases in students meeting standards over Vallas’ tenure.  With the latter there is some apples to oranges going on, the 2002 numbers cover grades 5.8 and 11; but by 2007 grades 3,4,6 and 7 have been added.   Philadelphia did not participate in NAEP during the Vallas years, but the performance on the Terra Nova were not as impressive as it was on the state tests and even here there were  problems.  Still, it is likely that scores did rise significantly in real ways under Vallas, but also needs to be noted that when he left only 47.0% of tested students were proficient in math, only 40.7 in reading and that that the schools turned over to outside Educational Management Organizations were below these dismal numbers.

Post Katrina New Orleans is a classic “not the same students, not the same schools” case that makes comparisons over time difficult, but there is reason not to believe the hype there either.  The Miracle Schools Wiki has lots of links that raise doubts and more.  Of particular concern are allegations made by the Louisiana School Board Association. of “scrubbing” low performers.

There is lots more out there on Vallas,  if you are interested I’d suggest clicking the links in the post, the links below and skipping the event.  If you care about schools and students, your Saturday would be much better spent working to get Scott Walker out of office (contact United Wisconsin to volunteer).  I know mine will be.

For further reading and viewing:

Diane Ravitch, “The Very Rewarding Job of Saving Schools.”

PBS coverage of Vallas (extensive on New Orleans).

Martha Abele Mac Iver and Douglas J. Mac Iver, “WORKING PAPER – Privatizing Education in Philadelphia: Are Educational Management Organizations Improving Student Achievement?”

Edward Hayes, “The man, the myth, the continuing nonsense.”

Debra Vaughan, Laura Mogg, Jill Zimmerman and Tara O’Neill”Transforming Public Education in New Orleans:  The Recovery School District.

Two takes on the fate of the Philadelphia School, now slated for dissolution:

Daniel Denvir, “Who’s Killing Philly Public Schools? Underfunded. Overburdened. About to be sold for scrap.

Doug Martin, “In the City of Corporate Love and Beyond: The Boston Consulting Group, Gates, and the Filthy Rich.”

and since these were mentioned in the Matt DeFour story

The Washington Times, “Military Schools on the Rise.”

Don Feder, “Book covers breach wall of separation.”

Jeffrey Felshman, “The Ten Commandments According to Paul” (parody).

Thomas J. Mertz

7 Comments

Filed under Accountability, Arne Duncan, Best Practices, education, Elections, Gimme Some Truth, Local News, nclb, No Child Left Behind, Scott Walker, Take Action, Uncategorized

Is it “all about the kids” (and what that might mean)? — Take One (in relation to ULGM and Madison Prep)

Sir Mack Rice “Money Talks” (click to listen or download)

My training as a historian has taught me that all knowledge is tentative and that this is especially true when it comes to assigning motives to people’s actions.  It has also taught me to not accept self-proclaimed motives at face value , to only state an opinion  about the motives of others when there is a preponderance of evidence,  and to look  at actions and consequences as well as  rhetoric when trying to make sense of things.

With those caveats,  I think it is worthwhile to investigate the motives, actions and the consequences of the actions of Kaleem Caire and some of others associated with the Madison Prep proposal and the Urban League of Greater Madison in relation to public education.

Enemies of teachers and teacher unions have seized upon the phrase “it is all about the kids” to ridicule and attack teachers and their representatives.   With union and (almost all) others, of course it isn’t “all about the kids.”  Interestingly, those who blame unions for some or all of the ills of public education — like many of  the proponents  of Madison Prep — often offer their own versions of “it is all about the kids.”  Examples include  Michelle Rhee who named her group Students First (Valarie Strauss pointedly offered a column on Rhee’s organization titled “Rhee’s campaign is not about the kids.”) and the anti-Union political bribery has been done  in Illinois (and elsewhere) under the banner of Stand for Children ( a must-see video here).

This is the first of a series of three “takes,” distinct but related investigations of what else besides concern for “the kids” might be fueling the Madison Prep effort and some thoughts about how a sincere effort largely or even exclusively on behalf of “the kids” can lead to consequences (intended or unintended or both) that many of us see as very harmful to “the kids.”

Take One:  Why did the Walton Family Foundation spend  $157 million last year on “education reform” (and almost as much in previous years) and how this relates to Madison Prep?

The Washington Post reported that in 2010 The Walton Family Foundation gave grants totaling over $157 million to what they deemed “education” reform efforts.  The entire list is here, and you can see the previous years here.  Under “Shaping Public Policy,” you can find such groups as the Barry Goldwater Institute for Public Policy Research; the National Right to Work Legal Defense & Education Foundation;  Wisconsin’s own Right Wing Press Release machine the John K. Maclver Institute for Public Policy, Inc.; and Kaleem Caire’s former employers the Black Alliance for Educational Options (BAEO).

The Walton Foundation describes its educational policy work and goals in this manner:

For parents to be empowered to choose among high-performing schools, local and state public policy must allow for those choices to exist. To this end, we seek to build the capacity of organizations to help enact, strengthen and protect programs that empower parents to choose high-performing schools.

Investment Strategies

Within our Shape Public Policy initiative, we focus on advocacy groups promoting:

  • Public charter school choice;
  • Private school choice;
  • District reforms, particularly open enrollment and district school choice; and
  • Cross-sector parental choice, parents are empowered to choose across school.

Note that the ability “to choose” is the goal, not universal access.   I want to return to this in the context of their relationship to Kaleem Caire  and Madison Prep, but first I want to say that there is a preponderance of evidence that the Waltons’ motives have very little to do “high powered schools” or education (especially the kind of education that makes people ask questions about the doings of people like the Waltons) and everything to do with destroying the public sector.  The same can be said to a great degree about many of the other supporters of Caire’s work, with some overtly racist and segregationist dimensions for at least the Bradley Foundation, who funded The Bell Curve and the Kochs who have been active in the re-segregation of Wake County NC schools (watch this powerful video, appropriately titled ” Why do the Koch brothers want to end public education? “).

As I was working on this Bill Lueders of the Wisconsin Center for Investigative Journalism released the first of his three part series on the Walton’s and other choice advocates’ activities in Wisconsin,  This saves me a lot of trouble preponding the evidence.  In part one you can read about the  tens of thousands of dollars in direct contributions to candidates, the uncounted indirect contributions via front groups,  the ties among individuals like the Waltons and Betsy and Dick DeVos and organizations such as the American Federation for Children and the Alliance for School Choice.    Not mentioned in part one of the Lueders piece is the relationships to American Legislative Exchange Council, another beneficiary of the Walton largesses and one that gets us closer to their public sector destroying mission.  You can also get a glimpse at some of the Walton’s federal activities via Open Secrets, here.

David Sirota’s “The bait and switch of school ‘reform“” brings it back to covers more of this, including the direct profit motive and the alliance of conservative and “neo-liberal” actors.  “Following the Charter Dollars” by Don Whittinghill of the Louisiana School Boards Association is also a must read (for those who want more on Louisiana, “NOLA Public Schools & School Privatization Part 1: Selected Bibliography of Articles, Books, Studies and Informed Opinions–2011 to 10/2010” is a good place to start; for the conservative movement ad the role of “think tanks” in general, this bibliography from the Commonweal Institute \\is very useful..

All these add to evidence that with the schools as well as in the workplace and for working parents, in the electoral arena,  in tax policy, on the environment and with so much more, The Waltons and there free market friends have interests that are very different than the well being of America’s children and very much geared toward weakening, undermining and destroying the good of the public sector.

Still, in a strange way if you believe that the entire American experiment in universal common schooling has been an irredeemable failure, public sector destroying may circle back to the quest for quality education .

I don’t believe that.  I’ve put in countless volunteer hours working for change and improvement in public education, but I’m more of a believer in the “Conservationist Ethic in Education”  and although it is often frustrating, Tinkering Toward Utopia has more appeal to me in public education than creative destruction, especially when the worth of what is being created in the wreckage is questionable at best.

For now though, let’s leave speculation about motives aside, take  them at their word  and assume that this is all or nearly all about the kids  and look at how that has worked out.  In essence that’s what Kaleem Caire has done and what he he is now asking the Board of Education and the taxpayers of Madison to do;  to follow the path prescribed by the Waltons and their ilk and see how it works out for the kids.

For the last decade  Kaleem Caire’s work has been funded by people like the Waltons and the Bradley Foundation, the (Milton) Friedman  Foundation and even the Koch Brothers.   It wasn’t always that way.  When he ran for the Board of Education in 1998 (the first Madison School Board campaign I was part of), the Capital Times reported

If elected, Caire says he will lead the fight against the ”very elitist conservatives who are trying to basically break the back of public education.”

Then he began working with or for these people.  Now he dismisses any objections to these alliances, as in the recent Wisconsin State Journal story:

“On the issue of vouchers, we agreed,” he said of his conservative benefactors. “On other things, we didn’t. I don’t listen to the guilt-by-association crap.”

He pointed out that other funders included the Bill and Melinda Gates Foundation and the Joyce Foundation, considered more left-leaning politically.

First and as an aside, very, very few people in ed policy consider the recent work done by the Gates Foundation (or to a lesser extent the Joyce Foundation) to be “left-leaning.”  They are more right-center  in a landscape that has been shifting steadily to the right.

Second, I don’t think “guilt-by-association” is “crap.”

I understand building coalitions and working with people you might otherwise disagree with toward a common goal, but you do have to choose your comrades and I think there should be some limits on who you are willing to associate with.  Maybe that’s just me.

One reason for limits is that there is a danger of being used, of having the distinct agenda of one party to the deal advanced to a much greater degree than your common goals.   It has become common for conservatives and corporate America to use Civil Rights organizations and minorities to help advance their agendas.  It is no accident that Linda Chavez is the face of the (also Bradley Foundation backed) Center for Equal Opportunity, and their attack on affirmative action and bilingual education at UW and elsewhere.  Just this week there was a story about the Congress on Racial Equality opposing Green Jobs at the behest of their funder ExxonSupporters of the AT&T/T-Mobile merger include the NAACP, the Gay & Lesbian Alliance Against Defamation, (yes, unions are not immune) the National Education AssociationThe national Urban League supports too.  All of these organizations have benefited from generous donations from the telecom behemoth.

I remember Caire’s mentor Howard Fuller saying “we use them, they use us,” but this seems to set the two parties up as equals in the exchange and we all know that one side has millions or billions of dollars at their disposal, while the other brings to the table little more than their energy and ability to complicate the racial politics.

So to see if the deal has been a good one, we have to return to “the kids.”  The Walton’s posit expanded choice as an end of itself;  Kaleem Caire has presented choice as a means to an end, the end being access to quality education and improved educational outcomes.  There is no question that the Waltons have been successful in expanding choice (and I’d add they have made significant progress in their less transparent goal of destroying public education).   Most of the evidence points to the conclusion that the aggregate impact of expanded choice on access to quality education has been negative.

It needs to be acknowledged that many individual children have benefited from expanded choice via vouchers and charters, but when the “greatest good for the greatest number” metric is employed, “choice” is found wanting, as is the Madison Prep proposal.

The latest study of the Milwaukee voucher program y by the Walton-funded University of Arkansas’ School Choice Demonstration Project concluded that in terms of academic achievement of students enrolled in private schools at taxpayer expense do on average no better than similar students  enrolled in MPS schools.   The mandated report from the Legislative Audit Bureau echoed this finding.  Less sophisticated readings of Department of Public Instruction data reveals that voucher students did worse on the WKCE than MPS students; this is true even if the comparison is confined to those eligible for free and reduced lunch.

Voucher proponents interested in student outcomes (no just choice for choice sake) have been reduced to pointing to superior graduation rates (a very questionable measure given the autonomy private schools have in this area) and making a convoluted case that the competition from vouchers has improved public schools.  The latter is both the first and last refuge of the free market reformers.  Their prime directive is that the competition of the market always produces progress.  It is also in the words of sometime Caire collaborator Jay P. Green of the Arkansas Project a win/win assertion for them.  Had the voucher schools performed better this would be evidence of success, but since they did not, the failure of privatization is redeemed by the success in the public sector, success that is said to depend o the presence of the failed private sector.   That’s the political/ideological analysis; more scholarly critiques, rejoinders  and dissents from the conclusions of the Arkansas Project and related “research”  check  the publications of the always worthwhile  National Education Policy Center Think Tank Review Project (and here), as well as Vouchers and Public School Performance: A Case Study of the Milwaukee Parental Choice Program  from the Economic Policy Institute.

The gold standard research on charter school choice is  the 2009 “Multiple choice: Charter performance in 16 states” publication from the The Center for Research on Education Outcomes at Stanford.   Here is their summary of the findings.

The study reveals that a decent fraction of charter schools, 17 percent, provide superior education opportunities for their students. Nearly half of the charter schools nationwide have results that are no different from the local public school options and over a third, 37 percent, deliver learning results that are significantly worse than their student would have realized had they remained in traditional public schools.

17% better, 46% about the same and 37% “significantly worse.”  Choice does not appear to have worked out very well for those who choose charter schools.

I’m not sure there is a rigorous way to assess the impact of “choice”  (charter and voucher), on the public schools.  Too much variation by state and local, too many variables all over and there are some things that I think are important that are difficult or impossible to quantify.  I do want to point to two things that should be part of the equation: money and the ill-defined nexus of support, energy, faith….

In terms of public money, things vary greatly by state, local and to some degree with each individual school.  We can safely say that in recent years federal policies have used federal funding to encourage and support charter schools and that this funding comes from an inadequate pool of total federal education dollars.   At the state level, funding mechanisms and comparative funding for public, charter and voucher-type schools vary widely and one must also consider who attends and the relative costs of educating different students (this is especially important with high needs special education students, who rarely enroll in choice schools).   In some locales and with vouchers in general the public “choice”  outlay per student is lower than the public school outlay; in others it is about the same or higher.  “Choice” proponents see the lower outlays as evidence of savings; opponents point to the how the loss of small number of students from any given school or grade rarely creates opportunities for savings via staff, facilities or program reductions (if you want to offer a class in Mandarin,  the cost will be about the same whether 15 or 25 students are enrolled) and see any diversion of funds as a problem.  I lean very much in the direction of the opponents.   One thing that is very clear is that a whole lot  of private money which could be invested in public schools is going to sell and support school choice.

In the case of Madison Prep, the money piece is clear and bad.  Ed Hughes has all the gory details based on the latest information (as far as I can tell — and I have asked — there is no final proposal or budget, but this link goes to a very basic budget document that came with the announcement of the second proposed school for young women).  The cost per pupil is about $15,000 in comparison to MMSD’s marginal cost per pupil of a little over $10,000 the payments to Madison Prep over five years would total over $27,000,000 and according to Ed Hughes’ calculations funding Madison Prep for hundreds of students will require annual cuts to the programs and services that serve the 24,000 students (12,000 in poverty) in MMSD.  Hughes works out the numbers in detail for “year four” and comes up with a $1.5 million estimate for that year’s Madison Prep related cut to the district budget.

Keep in mind that like all charter schools in Wisconsin, Madison Prep cannot selectively enroll based on race, poverty or academic success, so we really have no idea who these extra resources may go too.    In contrast, the district — if they have the resources — can and does target programs and services and allocations  based on a variety of factors.  I’ve advocated for the district to do this more extensively, more systematically and better.  Approving Madison Prep will further strain targeted programing and make equity based allocations harder and less likely.  Any way you look at the finances, the proposal almost certainly fails the greatest good for the greatest number test.  If it is about the kids, it is only about some of the kids, because most of the kids will see decreased investments in their futures.

I think the intangible aspects of “choice’s” and “choice” advocacy’s impact on public schools, what I called “support, energy, faith….” may be more important than the money.   I written before about the damage done by the self-fulfilling prophesy of looking to charter schools for innovation and creativity.  The big picture harm done by undermining support for public schools is touched on above (and indirectly in this post).   These are important, but I want to focus on something more immediate, the relationships between families and their schools.

An inevitable and often deliberate tactic of choice advocates is to play to and build on feelings of alienation and distrust families feel toward their schools.  The implicit and sometimes explicit messages are “you can trust us, you can’t trust them; we care, they don’t care; we know how to help your child; they don’t know how to help your child.”  A little distrust is healthy and probably justified, as is some skepticism about educational prowess.

However, when this goes too far (as it frequently does)  it strains and may break the family/school ties  of collaboration that are essential to success.   Even if  Madison Prep is approved many, many more struggling students will remain in district schools and these students need the combined and cooperative efforts of their families and the the schools.  If it is about the kids, this has to be taken into consideration.  Unfortunately, I fear that both in Madison and nationally much damage has already been done.

Pulling back a little (and circling back to innovation and creativity),  this cultivation of distrust also, further discourages dissatisfied parents and community members from getting involved in school and district issues, from demanding a seat at the table to fight for their vision of educational improvement.    In terms of helping the kids, there is much good that could be accomplished by having more diverse and dissatisfied  people working for district-wide improvement.

If there are a big take-aways or conclusions from all of this  they are 1. If access to quality educational opportunities and improved educational outcomes are the goal, if defined in this way “choice” advocacy is “all about the kids,” then it has not been a success; 2. “Choice” advocacy has been successful in damaging support for public schools; and 3.  Following the “choice” path laid out be the supporters of Madison Prep may help some, but would have a net negative impact on “the kids” of the district, who this is supposed to be all about.

I’m going to stop there (unless I go back and edit).  Kind of long for “take one.’  “Take two” will be much shorter, I promise (it is)

Note: A Public Hearing on the Madison Prep proposal has been scheduled for Monday October 3, at 6:00 PM in the Doyle Building Auditorium;

Thomas J. Mertz.

1 Comment

Filed under "education finance", Arne Duncan, Best Practices, Budget, Contracts, education, Equity, finance, Gimme Some Truth, Local News, National News, nclb, No Child Left Behind, Take Action, Uncategorized

How to Destroy Public Education — Lesson One

The Soft Boys – “I Wanna Destroy You” (click to listen or download)

One of the tactics employed by the  enemies of public education is to undermine confidence in our schools in order to weaken financial and other support and induce parents to look for non public options.  Some do this by pointing to real failures — like the achievement gaps between minority/non minority and poor/non poor students – and offering simplistic free market solutions (more on this approach in relation to the Madison Prep proposal very soon in a couple of posts I’m working on — #1 is done and up).

The Bradley, Gates, Walton….funded Fordham Institute puts a new twist on this strategy.  In a new report and the accompanying press materials they attempt to create a panic around research showing that our schools are doing exactly what they should be doing.

The report is called “Do High Flyers Maintain Their Altitude? Performance Trends of Top Students.”   The target audience is parents of high achieving students and policy makers obsessed with misapprehensions about global competitiveness.  The ostensible cause for panic is that over time students move in and out of the top decile on MAP tests; that some percentage of students who were near the top in 4th grade are not so near the top in later grades.  They don’t give much attention to the other part of this, that our schools take some kids from the lower percentiles and help them move to the top.  And although their sample  — not matched to the norm that defines the top 10%  — shows a net increase of “High Flyers,” they find a way to spin the data as a sign of failure (note that the miss-match between the sample and the norm group means that more than 10% of the students may be in the top 10%, but among the total universe of test takers and with real scores, 10% means 10% and there is no way that everyone can be in the top 10%, even in Lake Woebegon or Madison).

From the Press Release:

“If America is to remain internationally competitive, secure and prosperous,” said Chester E. Finn, Jr., Fordham’s president, “we need to maximize the potential of all our children, including those at the top of the class. Today’s policy debate largely ignores this ‘talented tenth.’ This study shows that we’re paying a heavy price for that neglect, as so many of our high flyers drift downward over the course of their academic careers.”

There is another subtext here of pitting the parents of mostly white and economically secure successful students against poor and minority families who tend to make up fewer of the top 10%.  With no apparent irony, above and  elsewhere they even borrow WEB DuBois phrase the “Talented Tenth” in the service of this divide and conquer maneuver:

The study raises troubling questions: Is our obsession with closing achievement gaps and “leaving no child behind” coming at the expense of our “talented tenth”—and America’s future international competitiveness?

No irony; no shame.

One more thing is that the assumption behind the spin is that mobility is bad and reproducing inequality is good.  In fact, that assumption is in one way or another behind their entire campaign against the public sector and the idea of the common good.

One last note:  The report itself has some very interesting and worthwhile data and analysis on achievement mobility, growth across the deciles, demographics in relation to these.  Skip the ideology and it is worth reading.

Thomas J. Mertz

6 Comments

Filed under Best Practices, education, Equity, Gimme Some Truth, National News, nclb, No Child Left Behind